
NBA Player Props Strategy: Expert Tips to Win More Bets
 Available in US
Table of Contents
The NBA prop betting market has evolved from a niche corner of the sportsbook into one of the most dynamic arenas for sharp bettors. While casual gamblers gravitate toward moneylines and spreads, those who take the time to develop a robust player props strategy often find themselves with a significant edge. The reason is straightforward: sportsbooks dedicate substantial resources to setting accurate game lines, but player props receive comparatively less attention, creating opportunities for bettors who do their homework.
Player props demand a different analytical approach than traditional wagers. You are not predicting which team wins or whether the game goes over a certain total. Instead, you are evaluating individual performance within the context of matchups, minutes, pace, and a dozen other variables that most recreational bettors ignore. This granularity is precisely where profit potential lives.
This guide breaks down the essential strategies you need to consistently find value in NBA player props. From understanding how sportsbooks construct their lines to identifying the statistical indicators that matter most, you will learn how to approach prop markets with the discipline and analytical rigor of a professional bettor. The goal is not to chase hot streaks or bet on your favorite players, but to build a repeatable process that generates positive expected value over time.
Understanding Player Prop Markets

The first step toward becoming a profitable prop bettor is understanding how sportsbooks actually set their lines. Unlike game spreads where hundreds of thousands of dollars flow in and drive the line toward efficient pricing, player props often have lower limits and attract less sophisticated money. This creates inefficiencies that persist longer than they would in higher-volume markets.
Sportsbooks typically set initial player prop lines using a combination of season averages, recent performance trends, and proprietary projections. They will look at a player’s median output in a given statistical category, adjust for known variables like home or away splits, and then factor in the upcoming opponent. The oddsmakers are not omniscient. They are working with limited time to set hundreds of lines across a full NBA slate, and mistakes happen regularly.
Line movement in prop markets tells a story, but it requires careful interpretation. A line moving from 24.5 points to 25.5 points might indicate that sharp bettors are taking the over, or it could simply reflect public money flooding in on a popular player. The key distinction lies in the odds attached to the move. If the line increases but the juice on the over becomes less favorable, sharp action is likely responsible. If the juice stays roughly even or tilts toward the over remaining attractive, public money is probably the culprit. Learning to read these signals takes time, but it provides valuable context for your own betting decisions.
Market efficiency varies dramatically across different prop types. Points props for star players tend to be the sharpest because they attract the most attention and action. Rebounds and assists for role players often have softer lines because fewer bettors analyze these markets deeply. Combination props like points plus rebounds plus assists introduce additional variance, which can work both for and against you depending on your analytical approach. The general principle is that the less attention a market receives, the more likely it contains exploitable value, assuming you have done the work to identify it.
Statistical Analysis for Player Props
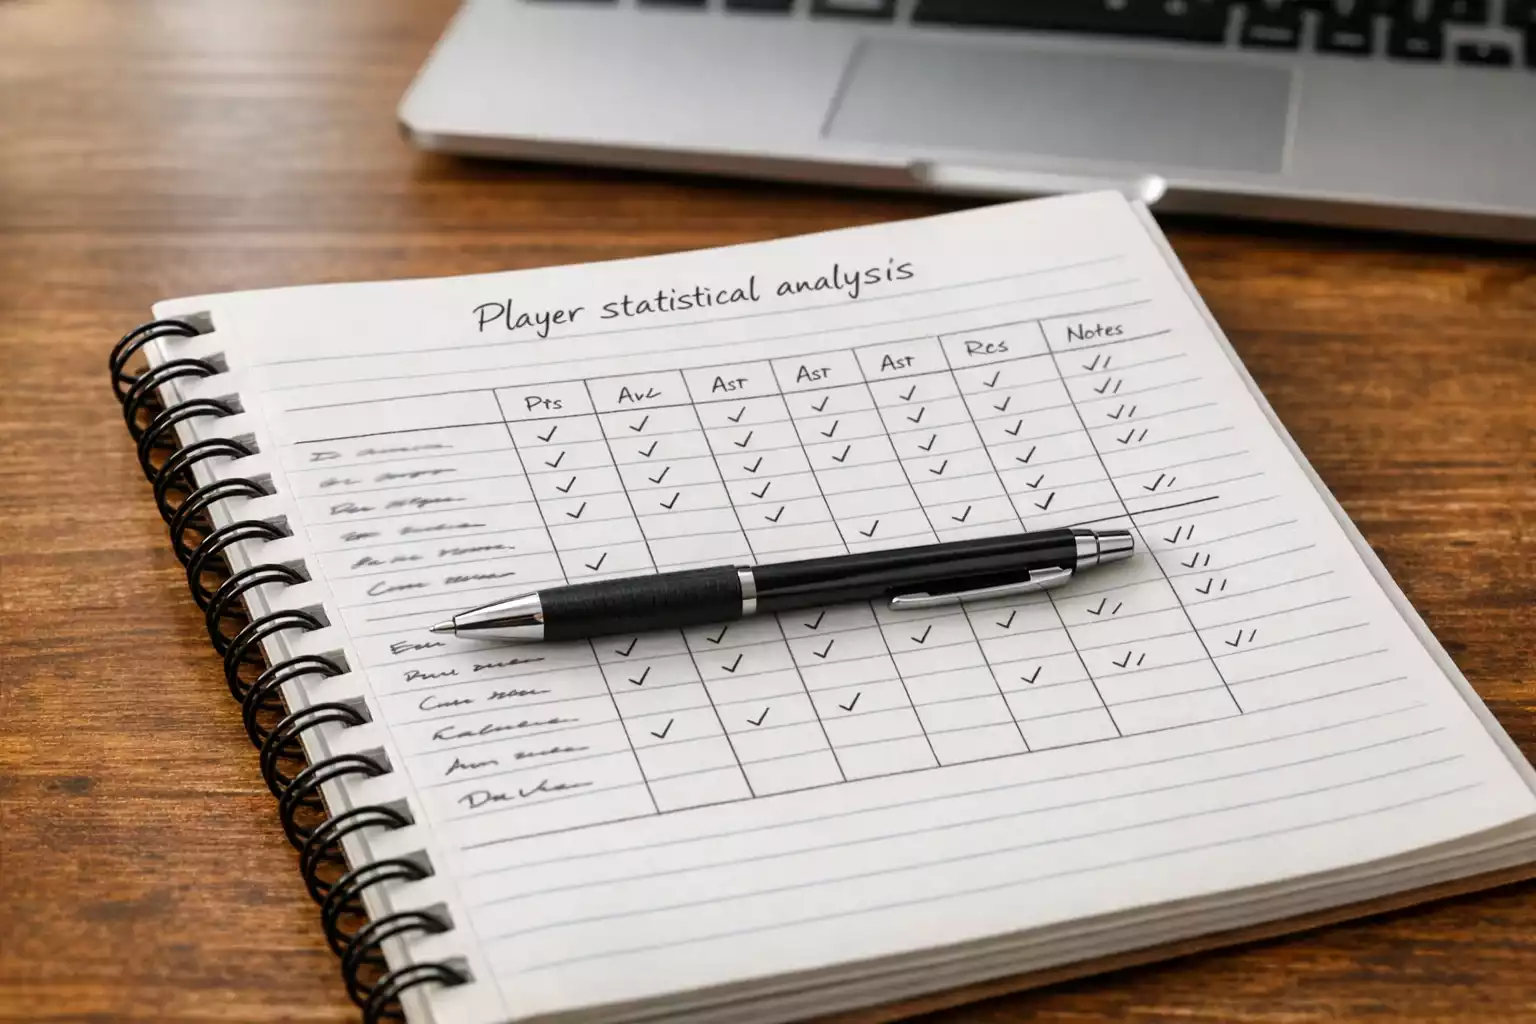
Raw statistics only tell part of the story when analyzing player props. A player averaging 22 points per game might seem like an easy over on a line of 20.5, but that number obscures critical context. How many of those games were against bottom-tier defenses? What happens to his scoring when his primary playmaker is on the floor versus off it? Does he tend to feast in home games but struggle on the road? Answering these questions requires moving beyond basic box score stats.
Recent form analysis should focus on the last five to ten games rather than full-season averages. The NBA season is long, and player roles evolve. A bench scorer who averaged 12 points in October might now be starting due to injuries and putting up 18 points regularly. Full-season averages lag behind this reality, but sharp sportsbooks adjust their lines based on recent trends. Your job is to determine whether the adjustment was sufficient or whether value remains.
Per-minute and per-possession statistics provide essential normalizing context. A player who averages 15 points in 28 minutes per game produces at a different rate than one who needs 36 minutes to reach the same total. If you expect the first player to see extra minutes due to a blowout or foul trouble affecting teammates, his scoring upside is substantially higher than the second player in the same situation. Per-possession stats like points per 100 possessions further control for pace differences between teams, allowing you to compare players across varying game contexts.
Advanced metrics deserve a place in your analytical toolkit, though they should complement rather than replace fundamental analysis. Usage rate measures the percentage of team possessions a player uses while on the floor, indicating how central he is to the offense. True shooting percentage accounts for the value of three-pointers and free throws, giving a more accurate picture of scoring efficiency than raw field goal percentage. Assist rate and rebound rate express a player’s contributions in those categories relative to available opportunities. These metrics help you understand not just what a player produces, but how sustainable that production is and how it might change under different circumstances.
The most overlooked analytical approach is tracking variance, not just averages. A player who averages 18 points with a standard deviation of 3 is far more predictable than one who averages 18 points with a standard deviation of 8. For the first player, betting the under on 20.5 points might be consistently profitable. For the second, the same line represents a coin flip despite the identical average. Analyzing game logs to understand distribution patterns, not just central tendencies, separates successful prop bettors from those who rely solely on averages and hope for the best.
Matchup Analysis Deep Dive

Individual talent matters, but basketball is ultimately a team sport where matchups dictate outcomes. A scorer who thrives against slow-footed centers might struggle when switched onto a mobile wing defender. Understanding these matchup dynamics is essential for predicting individual player performance with any degree of accuracy.
Opponent defensive rankings by position offer a starting point for matchup analysis. If a point guard faces a team that ranks 28th in defending opposing point guards, his scoring and assist props become more attractive. However, these rankings require careful interpretation. A team might rank poorly against point guards because they faced an unusually difficult schedule of elite opponents, not because their perimeter defense is genuinely weak. Conversely, a team with strong defensive numbers might have benefited from a soft schedule. Context always matters more than the raw rankings suggest.
Pace of play directly impacts raw statistical totals. A game between two uptempo teams that averages 105 possessions creates more opportunities for everyone on the floor than a grind-it-out affair that barely reaches 90 possessions. When projecting player props, you need to estimate the expected pace of the specific game, not rely on season averages that blend fast and slow games together. If two high-pace teams meet, overs on points and assists become more attractive. When two defensive-minded teams clash, unders often provide value even on players who normally exceed their lines.
Historical performance against specific teams reveals tendencies that transcend basic statistical analysis. Some players consistently dominate certain opponents for reasons that do not show up in defensive rankings. It might be a favorable size matchup, a particular defensive scheme they exploit well, or simply a mental edge built over years of success. While sample sizes for these head-to-head matchups are often small, patterns that persist over multiple seasons deserve attention. A player who has gone over his points line in eight of his last ten games against the same opponent probably has something working in his favor that the numbers alone do not capture.
Back-to-back game considerations add another layer of complexity. Players often see reduced minutes in the second game of a back-to-back, particularly during the regular season when coaches prioritize rest. Veterans and players with known injury histories are especially likely to sit extended periods or miss the game entirely. Even when a player takes the floor, fatigue can suppress performance below normal levels. Prop lines sometimes adjust for back-to-backs, but the adjustment is frequently insufficient, creating value on unders for fatigued players.
Injury Impact Analysis
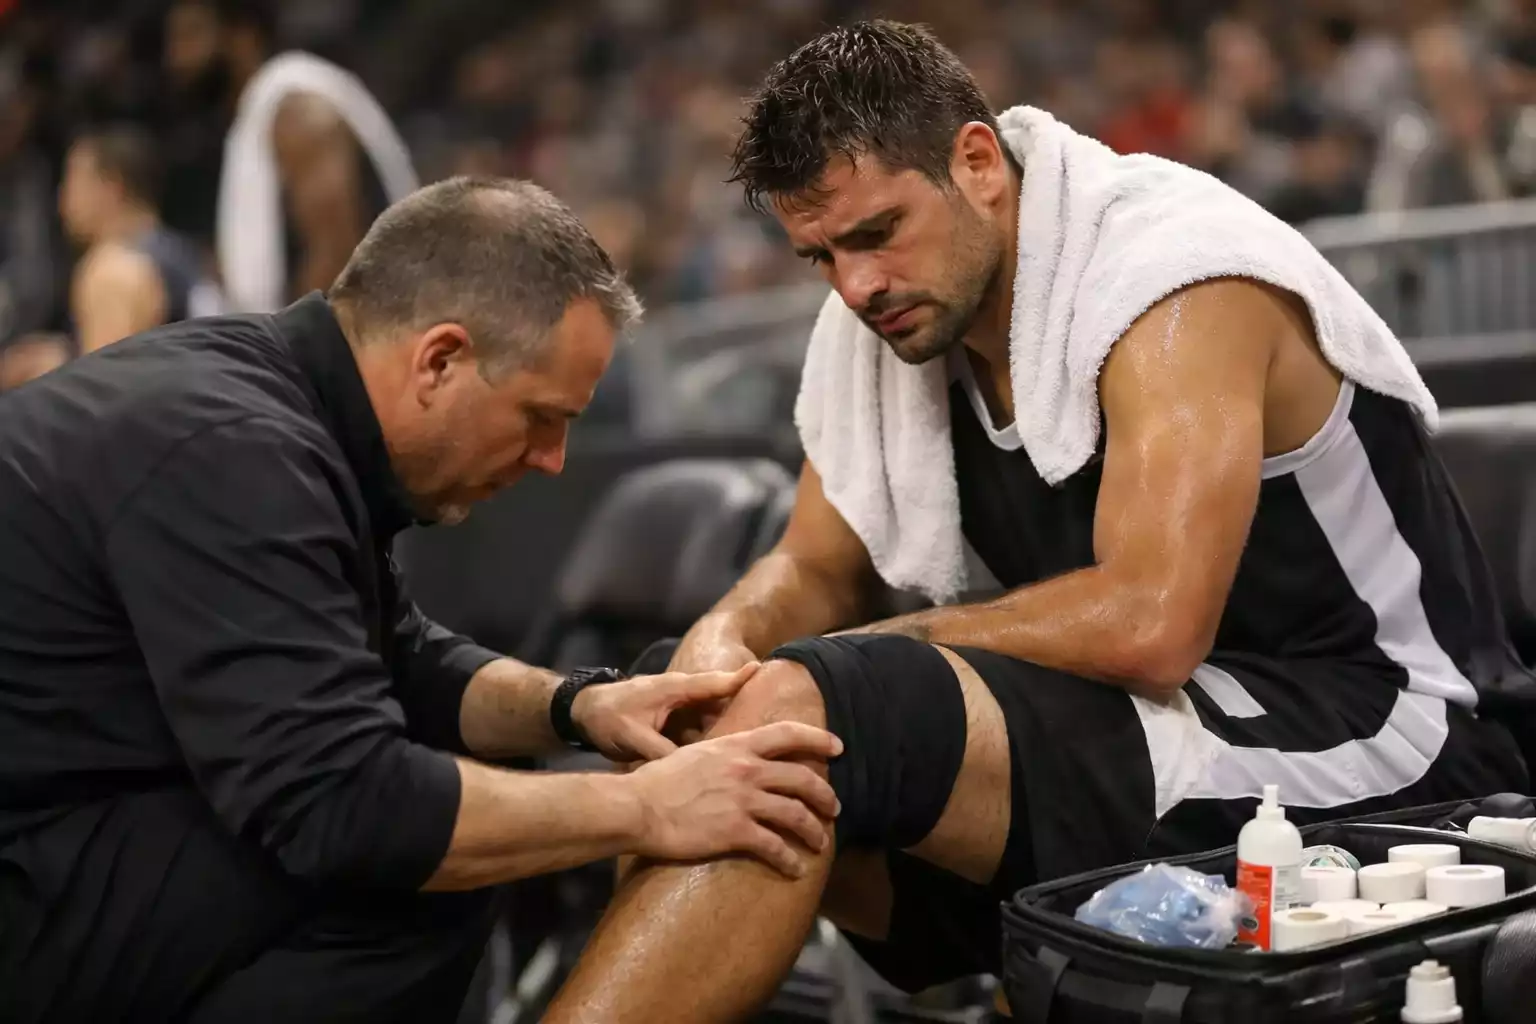
Injuries create the most significant opportunities in player prop markets. When a star player misses time, his teammates suddenly have more possessions, more shot attempts, and more opportunities to accumulate statistics. Sportsbooks adjust for these scenarios, but the adjustments are often imprecise because the cascading effects of an injury can be difficult to quantify in advance.
The direct impact on teammates varies based on roles and skill sets. When a primary scorer gets injured, the next-best offensive option usually sees the largest increase in usage. If a team loses its starting point guard, the backup point guard might see a modest boost, but the secondary playmakers and scorers often benefit more because they handle the ball in situations the starter would have dominated. Identifying who actually absorbs the lost production, rather than who seems like the obvious replacement, requires understanding team dynamics beyond the box score.
Usage rate shifts provide the clearest indicator of how injuries redistribute opportunity. A player whose usage rate jumps from 22 percent to 28 percent after a teammate goes down is handling significantly more of the offense. This increased responsibility usually translates to higher raw statistics, though efficiency might decline as the player operates outside his comfort zone. For prop betting purposes, raw totals matter more than efficiency, so usage increases typically signal value on overs.
Reading injury reports effectively demands attention to both the official designations and the surrounding context. A player listed as questionable with a knee injury who practiced fully the day before the game will likely play. A player listed as probable but who sat out the previous game with an illness might be on a minutes restriction. The official injury report provides a starting point, but beat reporters and team news offer essential supplementary information that shapes realistic expectations.
Late scratch strategies can generate significant edge for bettors who monitor information flows carefully. When a player is ruled out within an hour of tip-off, sportsbooks must rapidly adjust dozens of related lines. In the rush, they occasionally overcorrect or undercorrect on teammate props. Having a pre-established framework for how specific injuries should impact teammates allows you to identify these mispricings quickly and act before the lines settle into efficient territory. This approach requires preparation, but the reward for tracking potential injury impacts before they happen is the ability to capitalize when uncertainty peaks.
Finding Positive Expected Value Player Props
Expected value represents the mathematical foundation of profitable betting. A bet has positive expected value when its true probability of winning exceeds the probability implied by the odds. If a line implies a 50 percent chance of hitting, but your analysis suggests the actual probability is 55 percent, you have found a positive EV wager worth making regardless of whether it wins or loses on any individual occasion.
Calculating implied probability from American odds is straightforward once you know the formula. For negative odds, divide the absolute value of the odds by itself plus 100. A line of -110 implies a probability of 110 divided by 210, or roughly 52.4 percent. For positive odds, divide 100 by the odds plus 100. A line of +150 implies a probability of 100 divided by 250, or 40 percent. Comparing these implied probabilities to your own projections reveals whether value exists.
The challenging part is generating accurate probability estimates for player props. One approach is building your own projection model using historical data, matchup adjustments, and situational factors. This requires significant effort but produces the most reliable edge identification over time. A simpler approach is comparing lines across multiple sportsbooks and projections from reputable sources. If three out of four projection systems suggest a player will score 23 points and the line sits at 25.5, the under probably offers value even without your own model.
Determining when an edge is sufficient to warrant a bet depends on your confidence level and bankroll strategy. A perceived two percent edge might not justify a wager given the uncertainty inherent in your projections. A perceived five percent edge, especially when supported by multiple analytical factors pointing the same direction, represents a stronger case for action. The key is avoiding bets where your edge is marginal and your confidence is low. Discipline in selection separates profitable prop bettors from those who simply bet volume and hope for variance to favor them.
Tools and resources for prop analysis have expanded significantly in recent years. Projection systems from various sports analytics platforms provide baseline estimates you can compare against the market. Line comparison tools show odds across major sportsbooks in real time, making it easy to identify which book offers the best price on a specific prop. Social media accounts run by sharp bettors occasionally share their analysis, though following blindly without understanding their reasoning is rarely a sustainable strategy. The goal is to use these resources as inputs into your own decision-making process, not as substitutes for independent thought.
Bankroll Management for Props
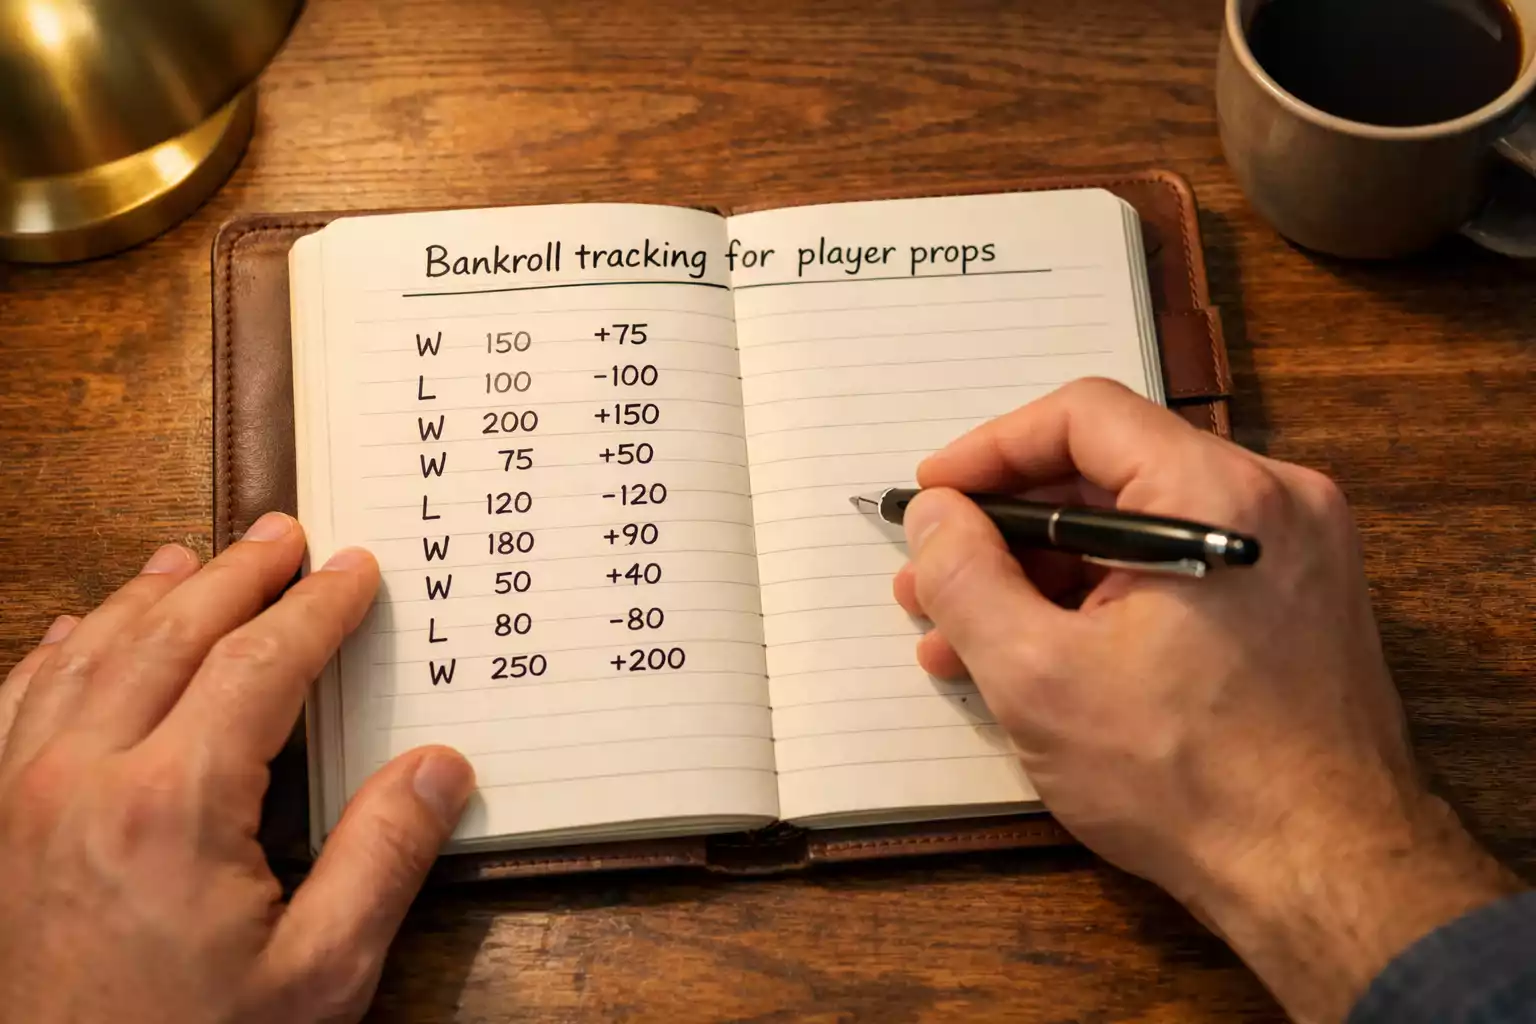
Unit sizing determines your ability to survive the inevitable losing streaks that even skilled prop bettors experience. A unit represents a standard bet size, typically one to two percent of your total bankroll. Betting consistent units prevents you from overexposing yourself on any single wager while allowing your bankroll to grow during winning periods.
Tracking and reviewing your betting performance is non-negotiable for long-term improvement. Recording every bet with the line, odds, stake, and result creates a database you can analyze for patterns. Maybe you consistently underperform on rebounds props but crush assists markets. Perhaps your unders hit at a higher rate than your overs. These insights allow you to refine your strategy over time, doubling down on what works and eliminating what does not. Without tracking, you are gambling blind, unable to distinguish skill from luck.
Adjusting stakes based on recent performance requires balancing confidence with humility. After a strong winning streak, increasing unit size slightly can accelerate bankroll growth. After a losing stretch, reducing unit size preserves capital while you reassess whether the losses resulted from bad variance or flawed analysis. The worst approach is dramatically increasing stakes to chase losses, a pattern that bankrupts more bettors than any other single mistake. Patience and consistency beat volatility over the long run.
Common Strategy Mistakes
Over-betting favorites is perhaps the most common error among recreational prop bettors. Steph Curry going over his three-pointers made seems like free money until you realize the line is set precisely because everyone expects him to shoot well. Popular players on winning teams attract disproportionate public action, pushing their lines to less favorable territory. Value often lies with lesser-known players on less glamorous teams, where the market pays less attention.
Ignoring context leads to bets that look good on paper but fail in practice. A player averaging 25 points faces a line of 22.5, and the under seems unlikely. But tonight he is facing the best perimeter defense in the league, his team is heavily favored and likely to rest starters in the fourth quarter, and he just returned from a minor ankle injury that might limit his explosiveness. Context transforms what seemed like an obvious over into a likely under. Every bet requires situational analysis beyond simple averages.
Emotional betting undermines even the most sophisticated analytical frameworks. Betting on your favorite player because you want him to succeed is not strategy. Betting against a player you dislike because watching him lose would be satisfying is not analysis. Profitable betting demands detachment from rooting interests and willingness to bet against players you enjoy watching when the value suggests you should. This emotional discipline is harder than it sounds and represents a barrier that many bettors never overcome.
Not tracking results prevents you from learning from experience. You might feel like your props strategy is working, but without data, you cannot distinguish genuine edge from a favorable run of variance. You might feel like you are struggling, but perhaps your recent losses came from a streak of close misses that will regress toward profitability. Feelings are unreliable guides. Data provides clarity, accountability, and the foundation for continuous improvement.
Building Your Approach
Profitable NBA player prop betting does not require exceptional luck or inside information. It requires a disciplined approach to analysis, realistic expectations about edge sizes, and the patience to let positive expected value compound over hundreds of bets. The market rewards those who do the work while punishing those who bet on reputation rather than research.
Start by specializing in specific prop types or specific players rather than trying to analyze the entire market. Depth of knowledge beats breadth when you are competing against sportsbooks with superior resources. As your tracking data accumulates and your hit rate stabilizes, you can expand into additional markets with confidence that your process works.
Remember that even the best prop bettors win only slightly more than they lose. A long-term hit rate of 54 percent represents an excellent edge that generates substantial profit over time. Expecting to win 60 or 70 percent of your props sets you up for disappointment and dangerous adjustments when reality inevitably falls short. Embrace the grind, trust your process, and let the mathematics of positive expected value work in your favor.
Recommend
Prepared by the nbapropbets.com editorial staff.
