
Types of NBA Prop Bets: Complete Breakdown of Every Market
 Available in US
Table of Contents
The NBA prop betting landscape offers far more variety than most casual bettors realize. Beyond the familiar points over/under on star players lies an extensive menu of wagering options covering nearly every measurable aspect of basketball performance. Understanding the full range of available prop types is essential for any bettor looking to find value, because the most profitable opportunities often hide in markets that receive less attention from the betting public.
Each prop category comes with its own characteristics, variance profiles, and analytical considerations. Points props behave differently than rebounds props, which behave differently than defensive statistics props. A strategy that works well for predicting assists might fail completely when applied to blocks or steals. Developing expertise across multiple prop types expands your opportunity set and allows you to capitalize on value wherever the market presents it.
This guide walks through every major category of NBA prop bets, explaining how each market works, what factors drive outcomes, and where sharp bettors typically find edges. Whether you prefer the relative predictability of scoring props or the higher variance of defensive statistics, understanding the full spectrum of available markets is the foundation for building a diversified and profitable prop betting approach.
Points Props
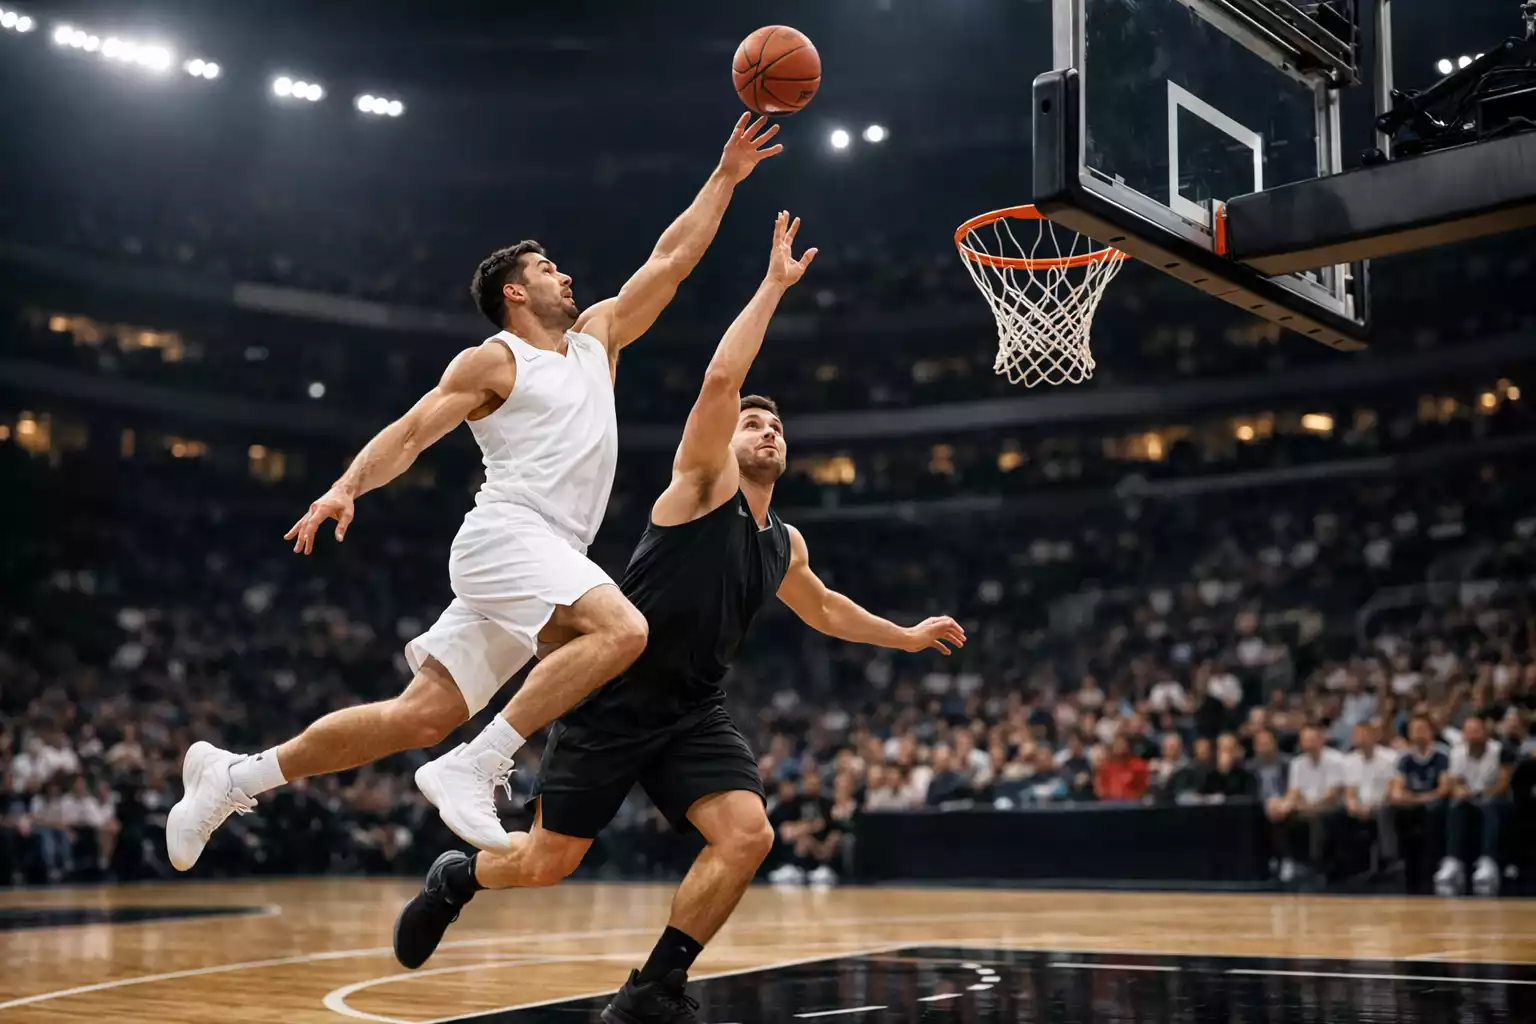
Points scored over/under represents the most popular and heavily bet player prop market in the NBA. Sportsbooks set a line reflecting their projection for how many points a player will score, and bettors choose whether the actual total will exceed or fall short of that number. The simplicity of the concept masks substantial complexity in the factors that determine outcomes.
Scoring output depends on opportunity more than pure skill once you reach the NBA level. Minutes played establishes the ceiling for how many points a player can reasonably accumulate. A player averaging 20 points in 32 minutes has a very different projection if he is expected to play 38 minutes due to a teammate injury versus 26 minutes on the second night of a back-to-back. Tracking expected minutes is therefore fundamental to points prop analysis, and sharp bettors often have better minute projections than the lines reflect.
Shot attempts represent the next layer of opportunity analysis. A player’s usage rate indicates what percentage of team possessions he uses while on the floor, providing insight into how many shots he typically takes relative to teammates. When a high-usage teammate is absent, remaining players absorb those shot attempts, often pushing their scoring above normal levels. The redistribution is not always proportional or predictable, which creates opportunity for bettors who understand team dynamics.
Matchup considerations shape scoring outcomes in ways that season averages cannot capture. A guard who averages 22 points might face a top-tier perimeter defender capable of limiting him to 15, or he might draw a weak defensive assignment that allows him to explode for 30. Defensive ratings by position provide a starting framework, but individual matchup history and schematic factors add nuance. Some players consistently dominate specific opponents for reasons that transcend generic defensive quality metrics.
Positional differences matter for points props as well. Guards typically have higher scoring variance than big men because perimeter shooting is inherently streaky. A guard might hit six three-pointers one night and miss every outside shot the next, creating a wider distribution of outcomes. Centers who score primarily at the rim through post-ups and putbacks tend to have more consistent outputs because their scoring does not depend on shooting variance. This difference in outcome distributions affects how you should approach lines for different position groups.
Rebounds Props
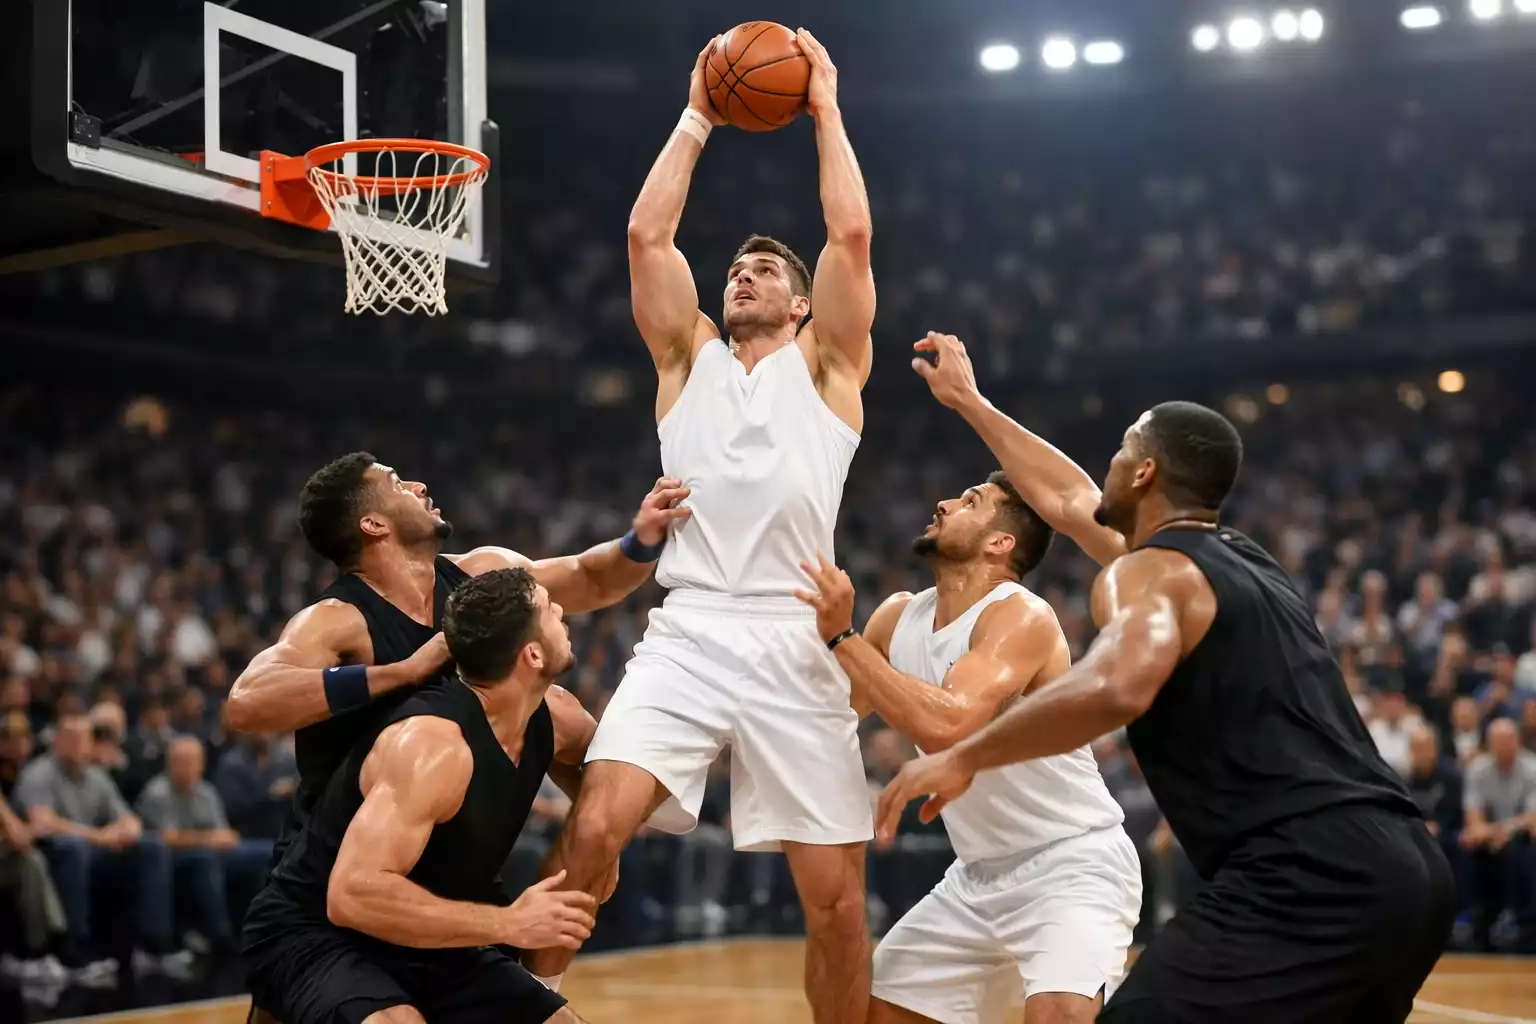
Total rebounds props challenge bettors to predict how many boards a player will collect, combining offensive and defensive rebounding into a single number. While rebounding might seem like a straightforward physical skill, the reality involves complex interactions between positioning, effort, team scheme, and game flow that create both predictability and variance.
Offensive rebounds are far more volatile than defensive rebounds. Most teams employ schemes where only one or two players crash the offensive glass while others retreat to prevent fast breaks. The players designated as offensive rebounders have opportunity, while others rarely collect offensive boards regardless of their physical ability. Understanding team rebounding schemes is therefore essential for projecting the offensive component of a player’s total.
Defensive rebounds are more predictable because they follow clearer patterns. The closest player to the basket when a shot misses typically grabs the defensive board, and big men naturally occupy those positions more often than guards. A center’s defensive rebounding depends heavily on his team’s defensive scheme and how opponents attack. Teams that force mid-range shots create different rebounding opportunities than teams that pack the paint and allow three-pointers.
Pace of play directly impacts rebounding totals because more shot attempts mean more rebounding opportunities. A fast-paced game with 100 combined field goal attempts produces more missed shots than a grind-it-out affair with 85 attempts. Missed shots create rebounds. When analyzing rebounds props, projecting the game’s pace gives you a baseline for total available rebounding opportunities before considering how those opportunities distribute among players.
Matchup considerations for rebounds differ from scoring matchups. A dominant offensive rebounder facing a team that allows easy post position will have more opportunities than one facing a team with elite box-out discipline. Some teams consistently allow high offensive rebounding rates regardless of opponent, while others rarely surrender second-chance opportunities. These team-level tendencies affect individual rebounding props more than the specific player guarding your target.
Assists Props
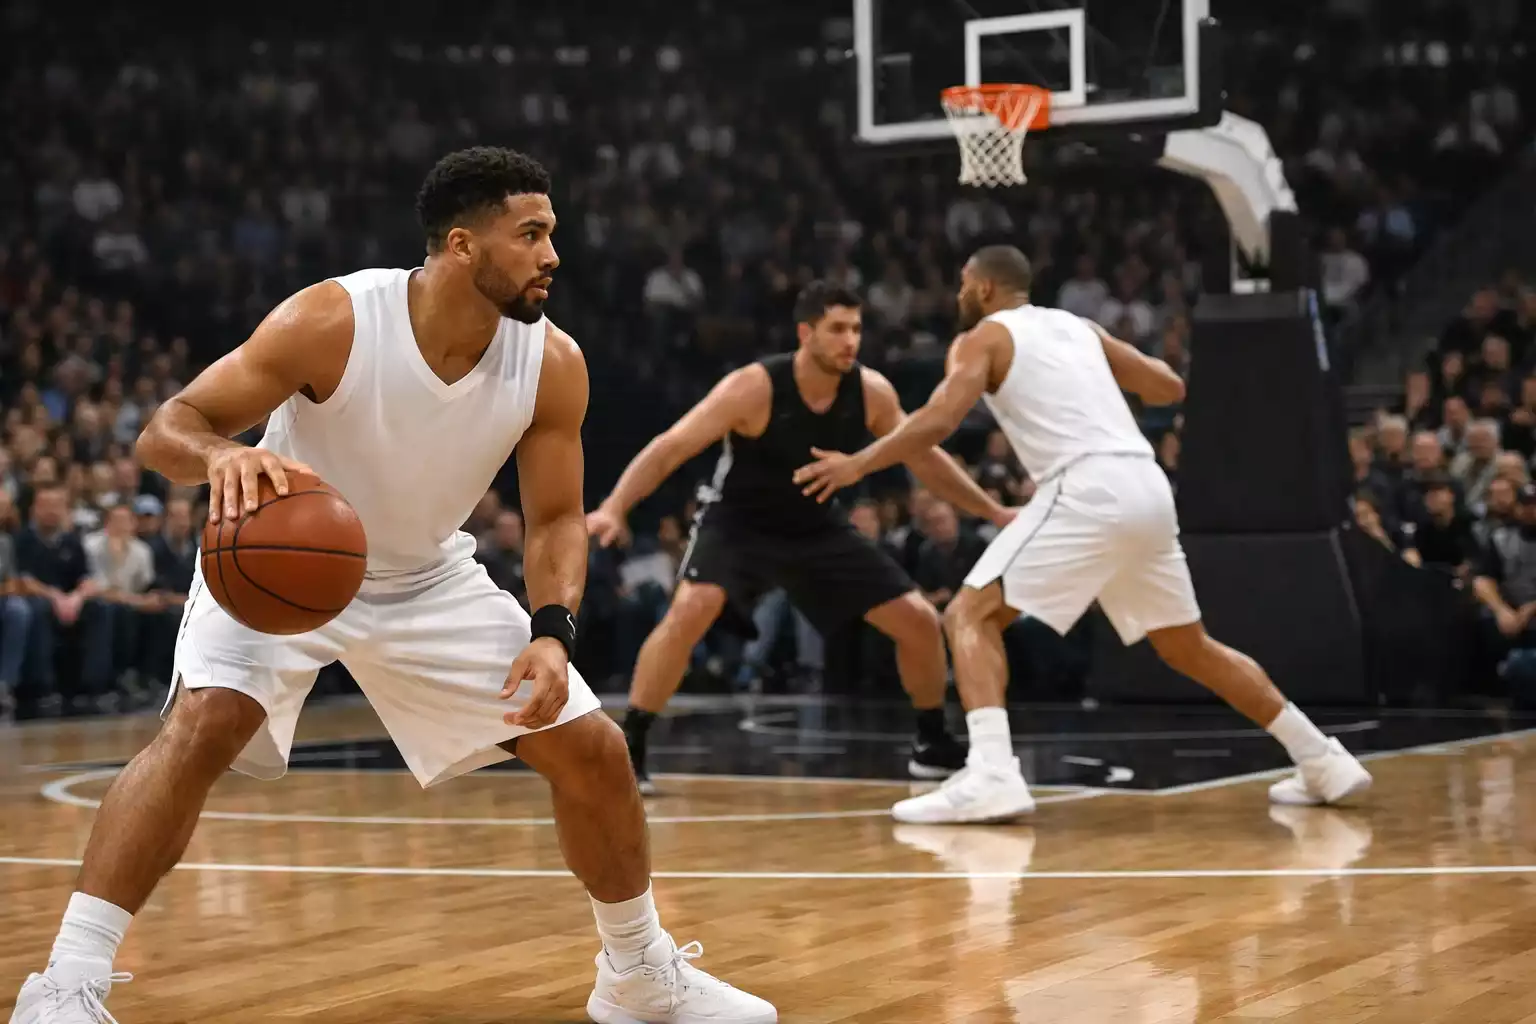
Assists props measure playmaking ability, but the actual assist totals a player records depend as much on teammates converting passes into made baskets as on the passer’s skill. A perfectly executed pass that leads to a missed shot generates zero assists, while a simple entry pass converted by a skilled finisher counts the same as a brilliant cross-court feed. This dependence on teammate performance introduces variance that pure playmaking skill cannot control.
Point guards dominate the assists prop market because they initiate most halfcourt offense and handle the ball more than other positions. A starting point guard might average eight assists while the power forward on the same team averages two, not because of a fourfold difference in passing ability but because of radically different roles. When analyzing assists props, comparing players within positional roles provides more useful context than cross-position comparisons.
Secondary playmakers present interesting prop opportunities because their assist totals are more variable than primary ball handlers. A forward who averages four assists might drop to two in games where the point guard dominates usage or spike to seven when that point guard is absent. These role-dependent fluctuations create value for bettors who track lineup dynamics carefully, as the secondary playmaker’s assists prop might not fully adjust for who else is or is not in the lineup.
Team offensive system dramatically affects individual assist totals. Motion offenses that emphasize ball movement produce assists distributed across multiple players, while isolation-heavy systems concentrate assists in the primary playmaker’s hands. A point guard on a motion offense might average similar assists to one on an isolation team, but the distribution around that average differs substantially. The motion offense point guard has lower variance because the system guarantees touches for teammates, while the isolation point guard depends more on creating individual advantages.
Pace considerations apply to assists just as they do to rebounds and points. More possessions mean more opportunities for passes that lead to baskets. A point guard in a fast-paced system has more chances to record assists than one playing for a slow, methodical team, even if their per-possession playmaking rates are identical. Adjusting assist projections for expected pace is a basic step that many recreational bettors skip.
Three-Pointer Props
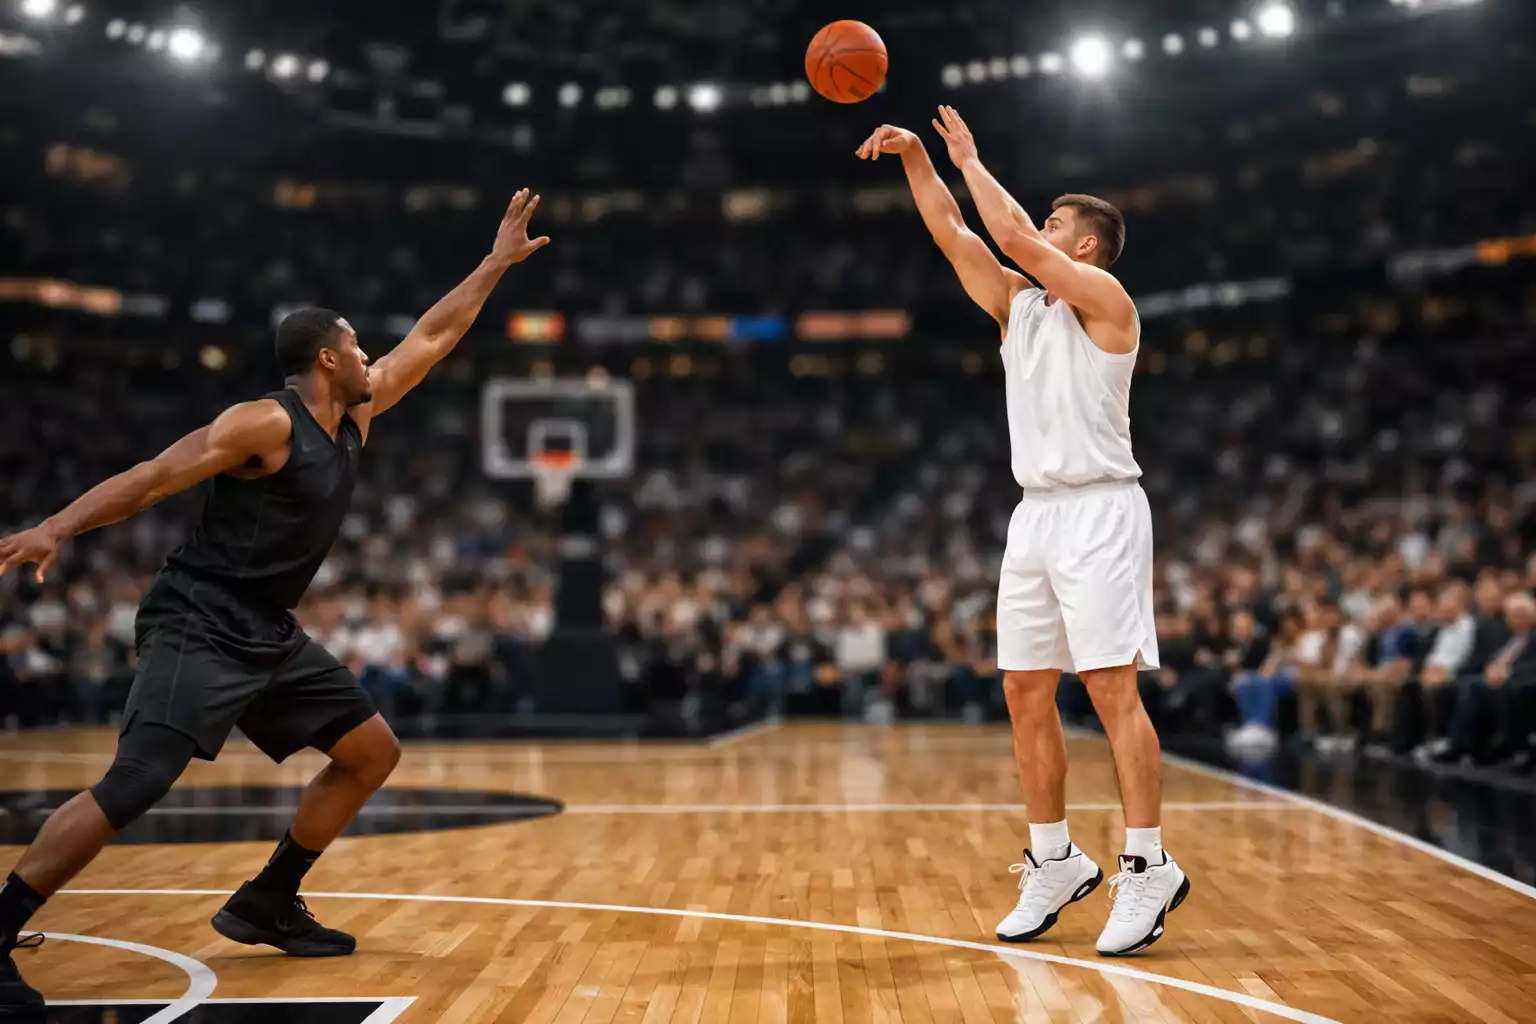
Three-point shooting props focus on made threes, typically presented as an over/under on how many a player will convert during a game. This market attracts significant action because three-point shooting is both exciting and notoriously volatile, creating opportunities for bettors on both sides depending on the situation.
Volume shooters who launch eight or more three-point attempts per game provide the most stable foundation for three-pointer props because large sample sizes reduce single-game variance. A player who takes ten threes and shoots 38 percent from deep will make roughly four most nights, with occasional games of two or six. This distribution is relatively predictable compared to role players who might attempt only three or four threes and could easily go 0-for-4 or 3-for-3 based on nothing more than normal shooting variance.
Role players on three-pointer props often represent trap bets because their attempt volume is inconsistent. A corner specialist might average 2.5 made threes per game, but that average includes games with five attempts and games with one attempt depending on how the defense plays and how the game flows. Betting the over on a player who might not even get enough attempts to reach the line is inherently risky regardless of his shooting percentage when he does shoot.
Matchup considerations for three-pointer props center on defensive closeout quality and scheme. Teams that aggressively close out on shooters limit open looks, while teams that prioritize protecting the paint concede more uncontested threes. A shooter facing a defense that habitually goes under screens will see more pull-up opportunities than one facing aggressive coverage. These schematic tendencies predict shot quality, which influences makes beyond what raw defensive ratings capture.
Game script affects three-point volume in predictable ways. Teams trailing by significant margins take more threes as they try to close the gap quickly. A player on a team expected to be behind will likely see elevated attempt volume, boosting his made threes prop even if the shooting percentage declines due to more contested looks. Conversely, a player on a heavy favorite might see his three-point attempts reduced if the game becomes a blowout and starters rest the fourth quarter.
Defensive Props
Steals and blocks occupy a unique position in the prop betting landscape because they combine lower frequency with higher variance than offensive statistics. A player who averages 1.5 steals per game might record zero steals in 30 percent of his games and three or more steals in 15 percent of his games. This distribution makes defensive props inherently more volatile than scoring or rebounding props.
Steals depend heavily on opponent tendencies and game context. Teams with careless ball handlers or predictable passing patterns surrender more steals than disciplined offensive teams. A perimeter defender known for jumping passing lanes will have more steal opportunities against a team that relies on cross-court passes than against one that attacks primarily through dribble penetration. Projecting steal opportunities requires understanding both the defender’s style and the opponent’s offensive patterns.
Blocks follow different patterns because they depend on shot-blocking positioning and opponent shot selection. A rim protector facing a team that attacks the basket aggressively will have more block opportunities than one facing a perimeter-oriented offense that avoids the paint. Some teams simply do not give shot blockers chances to affect shots because their offense operates away from the rim. Elite shot blockers facing such teams often disappoint on blocks props despite their individual ability.
Steals plus blocks combination props aggregate both defensive statistics into a single number, smoothing some of the variance inherent in each category while maintaining the unpredictability that defines defensive props. A player averaging 1.0 steals and 1.5 blocks might have a steals plus blocks line around 2.5, requiring him to exceed his average in one or both categories to hit the over. These combination props appeal to bettors who believe a player will have a strong defensive game without committing to which specific category will produce.
Identifying defensive specialists provides an edge in these markets because casual bettors focus on offensive statistics and overlook players whose value comes primarily from the defensive end. A role player averaging 2.0 steals per game might not draw significant betting attention, leaving his prop line softer than a star player’s scoring prop. Sharp bettors recognize that lower-profile defensive props often offer better value precisely because they attract less scrutiny.
Combination Props

Points plus rebounds props add a player’s scoring and rebounding totals into a single number, creating a market that appeals to bettors who want to bet on overall production without committing to a specific statistical category. These props are particularly popular for versatile forwards and centers who contribute in multiple areas.
The correlation between points and rebounds varies by player type and role. A center who scores primarily on putbacks will see his points and rebounds positively correlated because offensive rebounds create both rebounding stats and scoring opportunities. A perimeter scorer who rarely crashes the boards might have nearly independent points and rebounds distributions. Understanding whether a player’s scoring and rebounding correlate affects how you should approach his combination prop.
Points plus assists props capture the total offensive impact of playmakers who score and facilitate. For primary ball handlers, these props often move together because high-usage games typically produce both scoring and assist opportunities. A point guard who dominates the ball will either score himself or create for teammates, and usually both. This positive correlation means points plus assists props for primary playmakers are somewhat easier to project than the individual components.
Points plus rebounds plus assists, commonly abbreviated as PRA, represents the broadest measure of overall statistical production. This prop rewards versatile players who contribute across multiple categories and punishes specialists who dominate one area while contributing little elsewhere. For triple-double threats and all-around players, PRA props provide a way to bet on their comprehensive production without needing each individual category to hit.
Rebounds plus assists props attract less attention than other combinations because they exclude scoring, the statistic most bettors focus on. This lower visibility can create softer lines for players whose primary value comes from passing and rebounding rather than scoring. Big men who function as playmakers from the high post or point forwards who facilitate while also crashing the boards are natural targets for rebounds plus assists props.
Strategy for combination props should account for the correlation structure between component statistics. When components are positively correlated, the over becomes more likely because good games tend to be good across multiple categories. When components are negatively correlated or independent, variance increases and outcomes become harder to predict. Mapping these relationships for players you bet on regularly improves your ability to assess whether combination prop lines reflect true probability.
Special Player Props
Double-double and triple-double props bet on whether a player will reach double digits in two or three statistical categories respectively. These milestone bets appeal to bettors who follow versatile players capable of stuffing the stat sheet across multiple areas. The all-or-nothing nature of these props creates a different risk-reward profile than traditional over/under markets.
For double-double props, identifying players who consistently flirt with the threshold matters more than raw averages. A player who averages 11 rebounds and 9 assists is a better double-double target than one averaging 15 rebounds and 5 assists, even though the latter has a higher rebounding average. The first player needs only a slight positive variance in assists to reach the milestone, while the second needs a massive positive variance. Proximity to double digits in multiple categories drives double-double probability more than dominance in a single area.
First basket scorer props bet on which player will make the first field goal of the game. These props offer substantial plus-money odds because the field of potential scorers is large and the outcome involves significant randomness. However, patterns exist. Teams have tendencies for opening plays, certain players consistently receive early touches, and jump ball outcomes affect which team gets the first possession. Bettors who study opening sequences can find value in first basket markets.
Anytime scorer props, which pay out if a player scores at least one point during the game, are typically offered at heavy juice because almost every player who takes the floor records at least one point. These props become interesting only for deep bench players whose playing time is uncertain or for injury situations where a player might be on a minutes restriction. For regular rotation players, anytime scorer props rarely offer value because the probability of scoring is already priced accurately.
Player versus player props pit two players against each other in a specific statistical category, asking who will record more points, rebounds, or another stat. These head-to-head props eliminate the need to project absolute totals and instead focus on relative performance. They appeal to bettors who have strong convictions about matchups without confidence in exact statistical outputs. The key to player versus player props is identifying situations where one player has a significant situational advantage that the line does not fully capture.
Team Props
Team total points props set a line for how many points one specific team will score, independent of their opponent’s output. This differs from game totals, which combine both teams. Team totals allow you to bet on one side’s offense without needing the other team to cooperate, creating cleaner analytical opportunities when you have a strong read on one team but uncertainty about the other.
First team to score props bet on which squad will put the first points on the board. Jump ball outcomes, opening play tendencies, and early-game defensive intensity all influence this market. Some teams consistently score first due to aggressive offensive starts, while others often fall behind early before finding their rhythm. These tendencies create patterns that sharper bettors can exploit.
Team three-pointers made props aggregate shooting across an entire roster, reducing individual variance while maintaining exposure to three-point shooting outcomes. Teams with multiple perimeter shooters and systems designed to generate open threes have more predictable outputs than teams relying on one or two shooters. Defensive matchups that allow open perimeter looks push team three-pointer props toward overs.
Game Props
Overtime props bet on whether the game will require extra periods to determine a winner. Most NBA games end in regulation, so overtime props typically offer plus-money on the yes outcome and heavy juice on no. Close games between evenly matched teams present the best overtime opportunities, while lopsided matchups rarely deliver the tight finishes overtime requires.
First quarter and highest scoring quarter props segment the game into discrete periods with their own dynamics. Some teams start slowly and finish strong, while others jump out early and coast. These tendencies create quarter-specific value that full-game lines do not capture. Identifying teams with consistent quarter-by-quarter patterns allows you to find edges in these more granular markets.
Total combined score, while technically a game line rather than a prop, relates closely to team totals and individual scoring props. The same pace, defensive quality, and game script factors that drive player props also determine whether games go over or under their totals. Understanding game environment props provides context for evaluating individual player markets.
Season-Long Props
MVP and award betting offers season-long exposure to individual player performance at potentially attractive odds. Early in the season, identifying candidates before the market recognizes them can yield significant value. Award props require projecting not just performance but narrative appeal, as voter preferences sometimes favor storylines over pure statistics.
Statistical leader props bet on who will lead the league in specific categories like scoring, rebounding, or assists. These props depend on both individual performance and durability, since missing games through injury can derail a statistical leader campaign regardless of per-game dominance. Health projections and minute load management factor heavily into season leader analysis.
Win totals combine team performance projection with prop betting mechanics, offering over/under lines on how many games a team will win during the regular season. These props provide season-long engagement and can be hedged or traded as the season progresses and actual results provide information about whether the over or under remains likely.
Expanding Your Prop Repertoire
The breadth of NBA prop markets means no bettor can master every category simultaneously. Specialization produces better results than spreading attention across dozens of prop types without developing genuine expertise in any. Choose categories that match your analytical strengths and interest, then build deep knowledge that creates sustainable edge.
Different prop types suit different betting styles. Risk-averse bettors might prefer the relative predictability of points props for high-usage stars. Those comfortable with variance might gravitate toward defensive props where bigger mispricings offset lower hit rates. Combination props appeal to bettors who think holistically about player performance rather than focusing on single statistics.
The key to long-term profitability across all prop types remains consistent: understand what drives outcomes in each market, identify situations where your projection differs from the line, and bet only when the expected value justifies the risk. Apply this framework to any prop category, and you have the foundation for profitable betting regardless of which specific markets you choose to emphasize.
Recommend
Published by the nbapropbets.com team.
